


What Is Rock Mapping in Precision Agriculture?
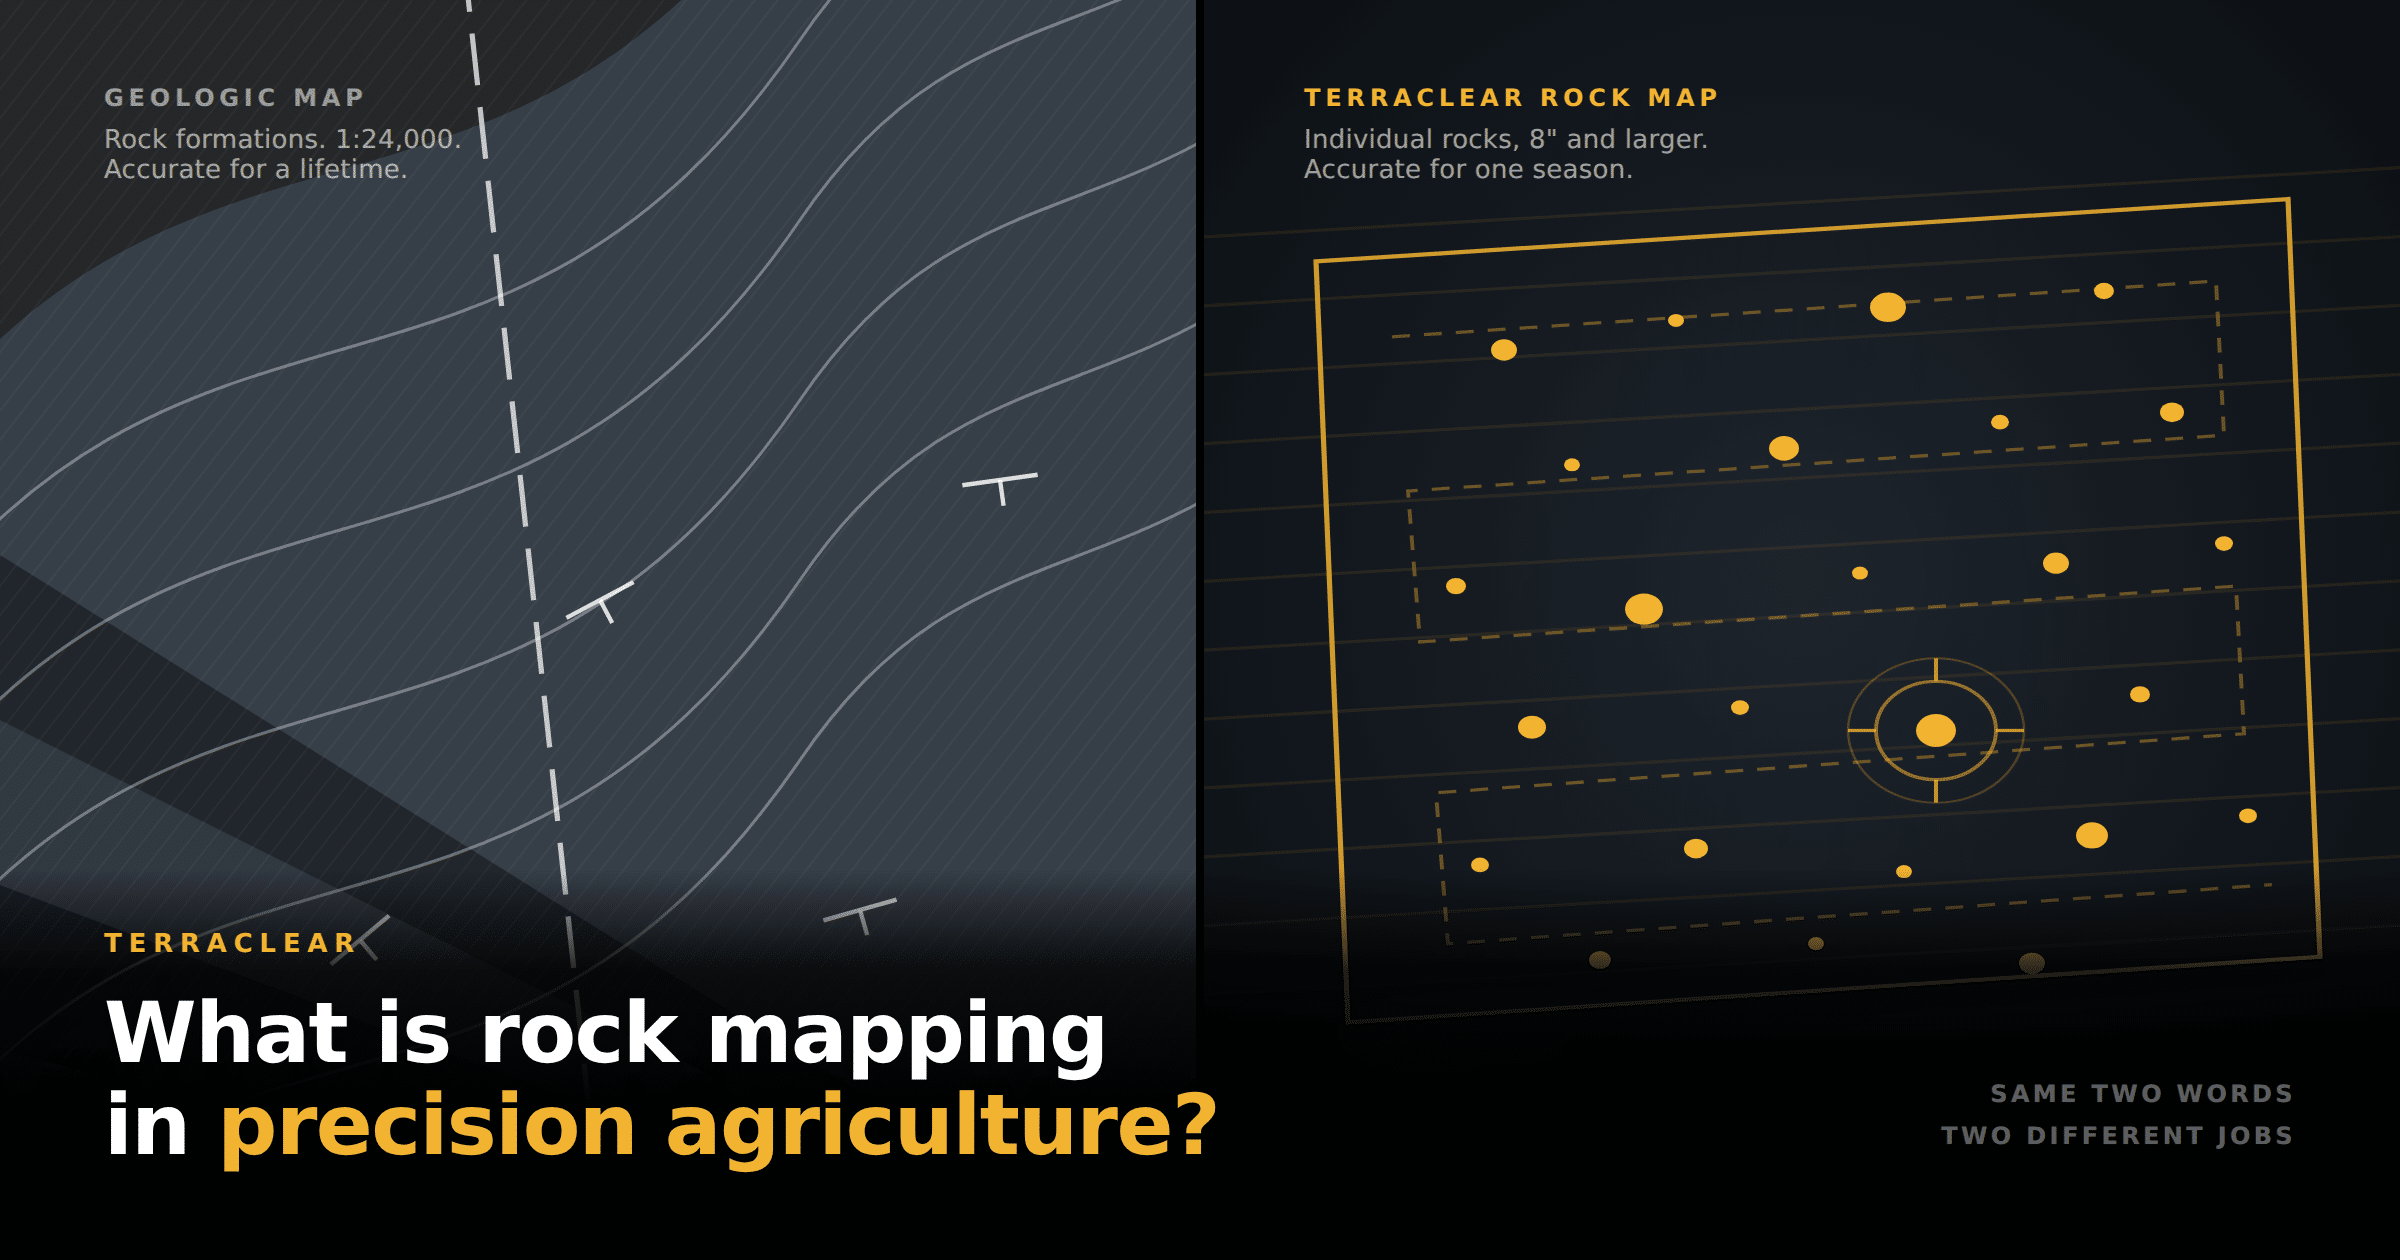
Two very different jobs go by the name rock mapping. One is a branch of earth science. The other is a field operation you can run on your farm. Here is the difference, and what a rock map is actually good for between harvest and planting (or even post planting).
Key takeaways
- Geologic maps and rock maps answer different questions. A geologic map tells you what the ground is made of. A TerraClear Rock Map tells you which rocks are in the way of your equipment this season.
- A geologic map stays accurate for a lifetime. A field rock map does not, because winter pushes new rock to the surface every year.
- Rock mapping in precision agriculture covers the whole field instead of a sample, and TerraClear returns maps the next day on average.
- Farmers using TerraClear Rock Maps have found about 3x more rocks and picked about 3x faster.
- The map does not pick anything. It tells you where to go and in what order, whether you run the job yourself or hire an independent operator.
Two different things are called rock mapping
Type “rock mapping” into a search bar and most of what comes back is geology. University lab manuals, state survey publications, and the Geological Society of America all use the phrase for the science of geologic mapping.
That is not what a farmer means. When you say you need your fields mapped for rock, you mean a seasonal, sub-meter problem: which rocks are up right now, how big they are, and where they sit relative to your planter pass.
Both meanings are legitimate. They just work at different scales. But if you go looking for help with your fields and land in the geology literature, you will find good maps that cannot tell you anything useful about the 8″ rock waiting for your combine.
What a geologic map actually shows
Geologic maps show rock formations, not individual rocks. The Utah Geological Survey describes them as depicting “the relative age, composition, and relationships among rocks and sediments at and near the earth’s surface.” A geologist walks outcrops, plots the contacts between map units on a topographic base, and records the orientation of rock layers with strike and dip symbols. Faults and folds go on the same sheet, and most geology maps carry a cross section showing how the rock is arranged straight down through the ground.
The work is done by the U.S. Geological Survey, state geological surveys, and universities. Scales run from 1:24,000 for detail work out to 1:250,000 for regional coverage, and the payoff is real. GSA reports benefit-to-cost ratios from 4:1 to greater than 100:1 across groundwater, hazard, and infrastructure work.
None of that helps you at planting. At 1:24,000, one inch on the map is 2,000 feet on the ground. A rock that will cost you a rotor does not register.
What a geologic map explains about your fields
Geology does answer one question that matters to you, and it is not “where are my rocks.” It is “why do I have so many.”
If you farm the northern Corn Belt or the Northern Plains, you farm glacial deposits. The Laurentide Ice Sheet, in the USGS’s phrasing, “at times blanketed much of the north-central and northeastern United States,” and what it left behind is till. USGS defines till as “a predominantly nonsorted and nonstratified, generally heterogeneous mixture of clay, silt, sand, granules, pebbles, cobbles, and boulders deposited directly by glacial ice.”
Boulders are in the definition. The same ice that built the deep soils across Minnesota, the Dakotas, and Iowa mixed rock through the profile on its way out. Your rock problem is not bad luck. It is a feature of the ground you bought.
It is also why the supply never runs out. USDA NRCS defines cryoturbation as “the physical mixing of soil material within a pedon by frost churning,” and lists “sorted rock fragments” as one of its field signatures. Freeze and thaw works the coarse fraction upward. Add tillage, and you get a fresh crop of rock at the surface after most winters.
A geologic map is made once and stays true for generations. A field rock map is only useful if you remake it.
What rock mapping in precision agriculture is
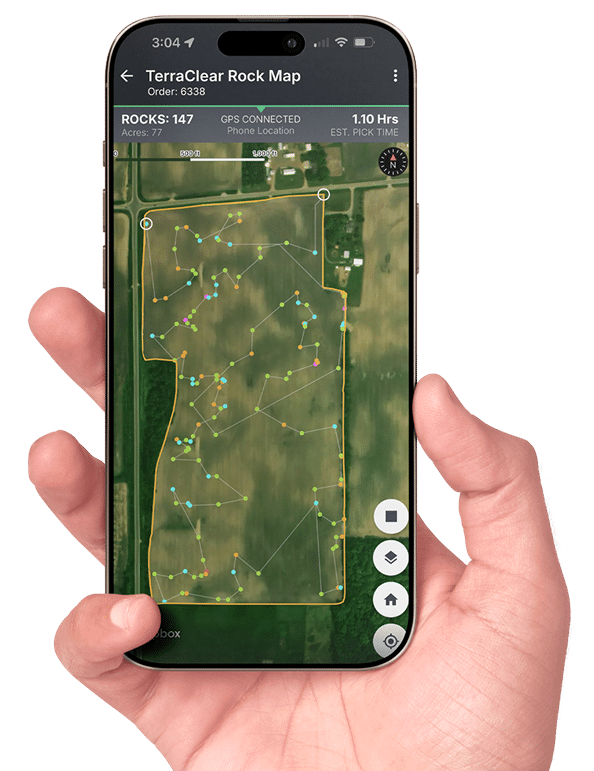
Rock mapping in precision agriculture is the process of imaging a field at high resolution, using AI to detect and size the rocks visible at the surface, and returning a georeferenced map of those rocks with a route you can drive.
TerraClear Rock Maps identify visible rocks 8″ and larger across every acre of the field, with GPS-pinpointed locations. Imagery is captured by drone today. Maps come back the next day on average, delivered to the TerraClear app on the phone or tablet you already carry.
Two things separate this from the scouting you already do.
The first is coverage. TerraClear images the whole field, wall to wall, rather than sampling a grid and interpolating between points. Rock does not spread evenly. It concentrates in a few places, and a sample is most likely to miss exactly the spots that cost you money.
The second is what human scouting misses. AgWeb has put the shortfall of manual crews at 60% to 70% of the rocks in a field. That is not a knock on anybody’s crew. Rock hides in residue, sits half buried, and blends into wet ground. No system catches all of it either. But farmers running TerraClear Rock Maps have found about 3x more rocks than they were finding before, and picked about 3x faster. Across the customer base, TerraClear has found more than 3 million rocks.
Locate, prioritize, remove
The map is the easy part. Working it comes down to three decisions.
Locate first. Open the map and every detected rock is plotted with its size, plus a photo you can tap to confirm before you climb down. You are not hunting anymore. You are driving to known coordinates at centimeter-level precision.
Then prioritize, which is the step most operations skip and where the time actually gets saved. Filter the map by size and pick to a threshold instead of picking everything. If the goal is protecting a combine before harvest, the biggest class earns the trip and the rest can wait. Prepping ground for a drill sets a different threshold. One map supports several passes over several seasons, each with its own rule.
Then remove. Every map comes with a precision plan, meaning the field-by-field route and action list that ships alongside the rock data, so you are not crossing the field four times. From there the picking is your call. Run it yourself, put your crew on it, or contact an independent rock picking operator and share the map with them from the app. TerraClear maps the rock. Who takes it out is up to you.
Geologic map or Rock Map: which one you need
| Geologic map | TerraClear Rock Map | |
|---|---|---|
| What it maps | Rock formations and sediment units | Individual rocks at the surface, 8″ and larger |
| Scale | 1:24,000 to 1:250,000, by quadrangle | Sub-meter, by field |
| Dimension | 3D and interpretive, including cross sections | 2D inventory of what is up right now |
| Shelf life | Decades | One season, until the ground is worked or frozen again |
| Who makes it | USGS, state surveys, universities | TerraClear, per field, per order |
| Decision it serves | Where to drill, build, zone, or assess hazard | Which rocks to pull before the next pass |
| How you get it | Free download from a survey’s map library | Order your acres in the TerraClear app |
Neither is a substitute for the other. If you want to understand why your northeast quarter throws rock and your home place does not, pull the geologic map for your county. If you want to keep a rock out of the combine in October, that is a different tool.
No. Geological mapping is an earth science discipline that maps rock formations, faults, and folds across large areas, and those maps stay accurate for decades. Rock mapping in precision agriculture inventories the individual rocks sitting at the surface of one field in one season, at a resolution fine enough to drive to.
Visible rocks 8″ and larger. The threshold is set by what damages equipment and what is worth stopping the machine for, not by what the camera can resolve.
Next day on average from the time your field is imaged.
Any time rocks are visible from above. Post-harvest and post-tillage in the fall, after snow melt in the spring, or after crop emergence as long as the rock is not covered. Fall and early spring give you the most usable window, since the map is freshest relative to your next equipment pass.
It gives you GPS-pinpointed locations at centimeter-level precision, plus a photo of each detected rock so you can confirm what you are looking at. Fields are variable, and the map guides you to the rock rather than promising a survey stake.
No. TerraClear builds the map. You can pick with your own crew and equipment, or use the app to find and share your map with an independent rock picking operator in your area.
For most operations, yes. Freeze-thaw and tillage bring new rock to the surface, so a map from two seasons ago describes a field you no longer have.
Find out what is actually in your fields
See what whole-field rock mapping turns up on your acres, or read the cost breakdown on what field rocks are already costing your operation.
Sources cited
- Utah Geological Survey, Geologic Maps: What Are You Standing On?, Public Information Series 66. https://ugspub.nr.utah.gov/publications/public_information/pi-66.pdf
- Geological Society of America, position statement on geologic mapping. https://www.geosociety.org/science-policy/position-statements/geologic-mapping
- Fullerton, D.S., Bush, C.A., and Pennell, J.N., 2003, Map of Surficial Deposits and Materials in the Eastern and Central United States, USGS Geologic Investigations Series I-2789. https://pubs.usgs.gov/imap/i-2789/i-2789_p.pdf
- Soller, D.R., and Garrity, C.P., 2018, Quaternary Sediment Thickness and Bedrock Topography of the Glaciated United States East of the Rocky Mountains, USGS Scientific Investigations Map 3392. https://www.usgs.gov/maps/quaternary-sediment-thickness-and-bedrock-topography-glaciated-united-states-east-rocky
- Ditzler, C., USDA NRCS, A Glossary of Terms Used in Soil Survey and Soil Classification, 2017. https://www.nrcs.usda.gov/sites/default/files/2022-08/A_Glossary_of_Terms_Used_in_Soil_Survey_and_Classification.pdf
- Soil Science Division Staff, USDA NRCS, Soil Survey Manual, 2017, Chapter 3. https://www.nrcs.usda.gov/sites/default/files/2022-09/SSM-ch3.pdf
- Grassi, M.J., “Rock-Eating Velociraptors,” AgWeb, Sept. 9, 2024. https://www.agweb.com/news/business/technology/rock-eating-velociraptors-terraclear-combines-drone-scouting-futuristic-machinery-nab-pesky-boulders
- TerraClear customer results, 2026. Figures reflect measured customer outcomes, not guaranteed results.

Charles Stover is a Marketing Manager at TerraClear. His marketing career spans 20+ years in broadcast, healthcare, SaaS, and ag tech, with a focus on building and executing award-winning, data-driven campaigns. He’s a University of Oregon School of Journalism grad, a girl dad, and a lifelong Ducks fan. Find him at Charles-Stover.com or on LinkedIn