


Weed Mapping 101: How a Precision Map Cuts Herbicide Without Cutting Control
A weed map is not a picture of your field. It is a spray plan your sprayer can run. Here is how it gets built, what the research says it saves, and where it pencils out on corn and soybeans.
Key takeaways
- A weed map is a prescription, not a photograph. It tells a section or nozzle-control sprayer where to turn on and where to stay off.
- Coverage and timing decide whether it is usable. A sampled map or a late map describes a field that no longer exists.
- University trials put targeted-application savings between 44% and 91% in soybeans, with the biggest savings in the cleanest fields.
- TerraClear customers have used up to 80% less chemical while running the same mix and the same rate on the weeds they hit.
- If your sprayer already has section or nozzle control, you own the equipment this needs. The map is the only new thing.
What weed mapping actually is
Weed mapping is the process of imaging a field at high resolution, identifying where weeds are growing and how thick they are, and converting that into a georeferenced prescription a sprayer can execute. Instead of treating every acre the same, the sprayer turns on over weeds and stays off where there are none.
That is the whole idea. The hard part is doing it across a real operation, at a price that makes sense, fast enough to still matter when you get to the field.
It also helps to say what a weed map is not. A satellite vigor image tells you something is happening inside a 10-meter pixel, but it cannot resolve a 2″ waterhemp. A scouting note tells you a field has a problem, but it does not tell a boom what to do. A map is a file, and what you do with it is your call.
What a good map contains is density, not just presence. That is what lets you write different rates for different parts of the same pass instead of one rate everywhere.
How weed mapping works, in four steps
The workflow is the same whether you are mapping 400 acres or 4,000.
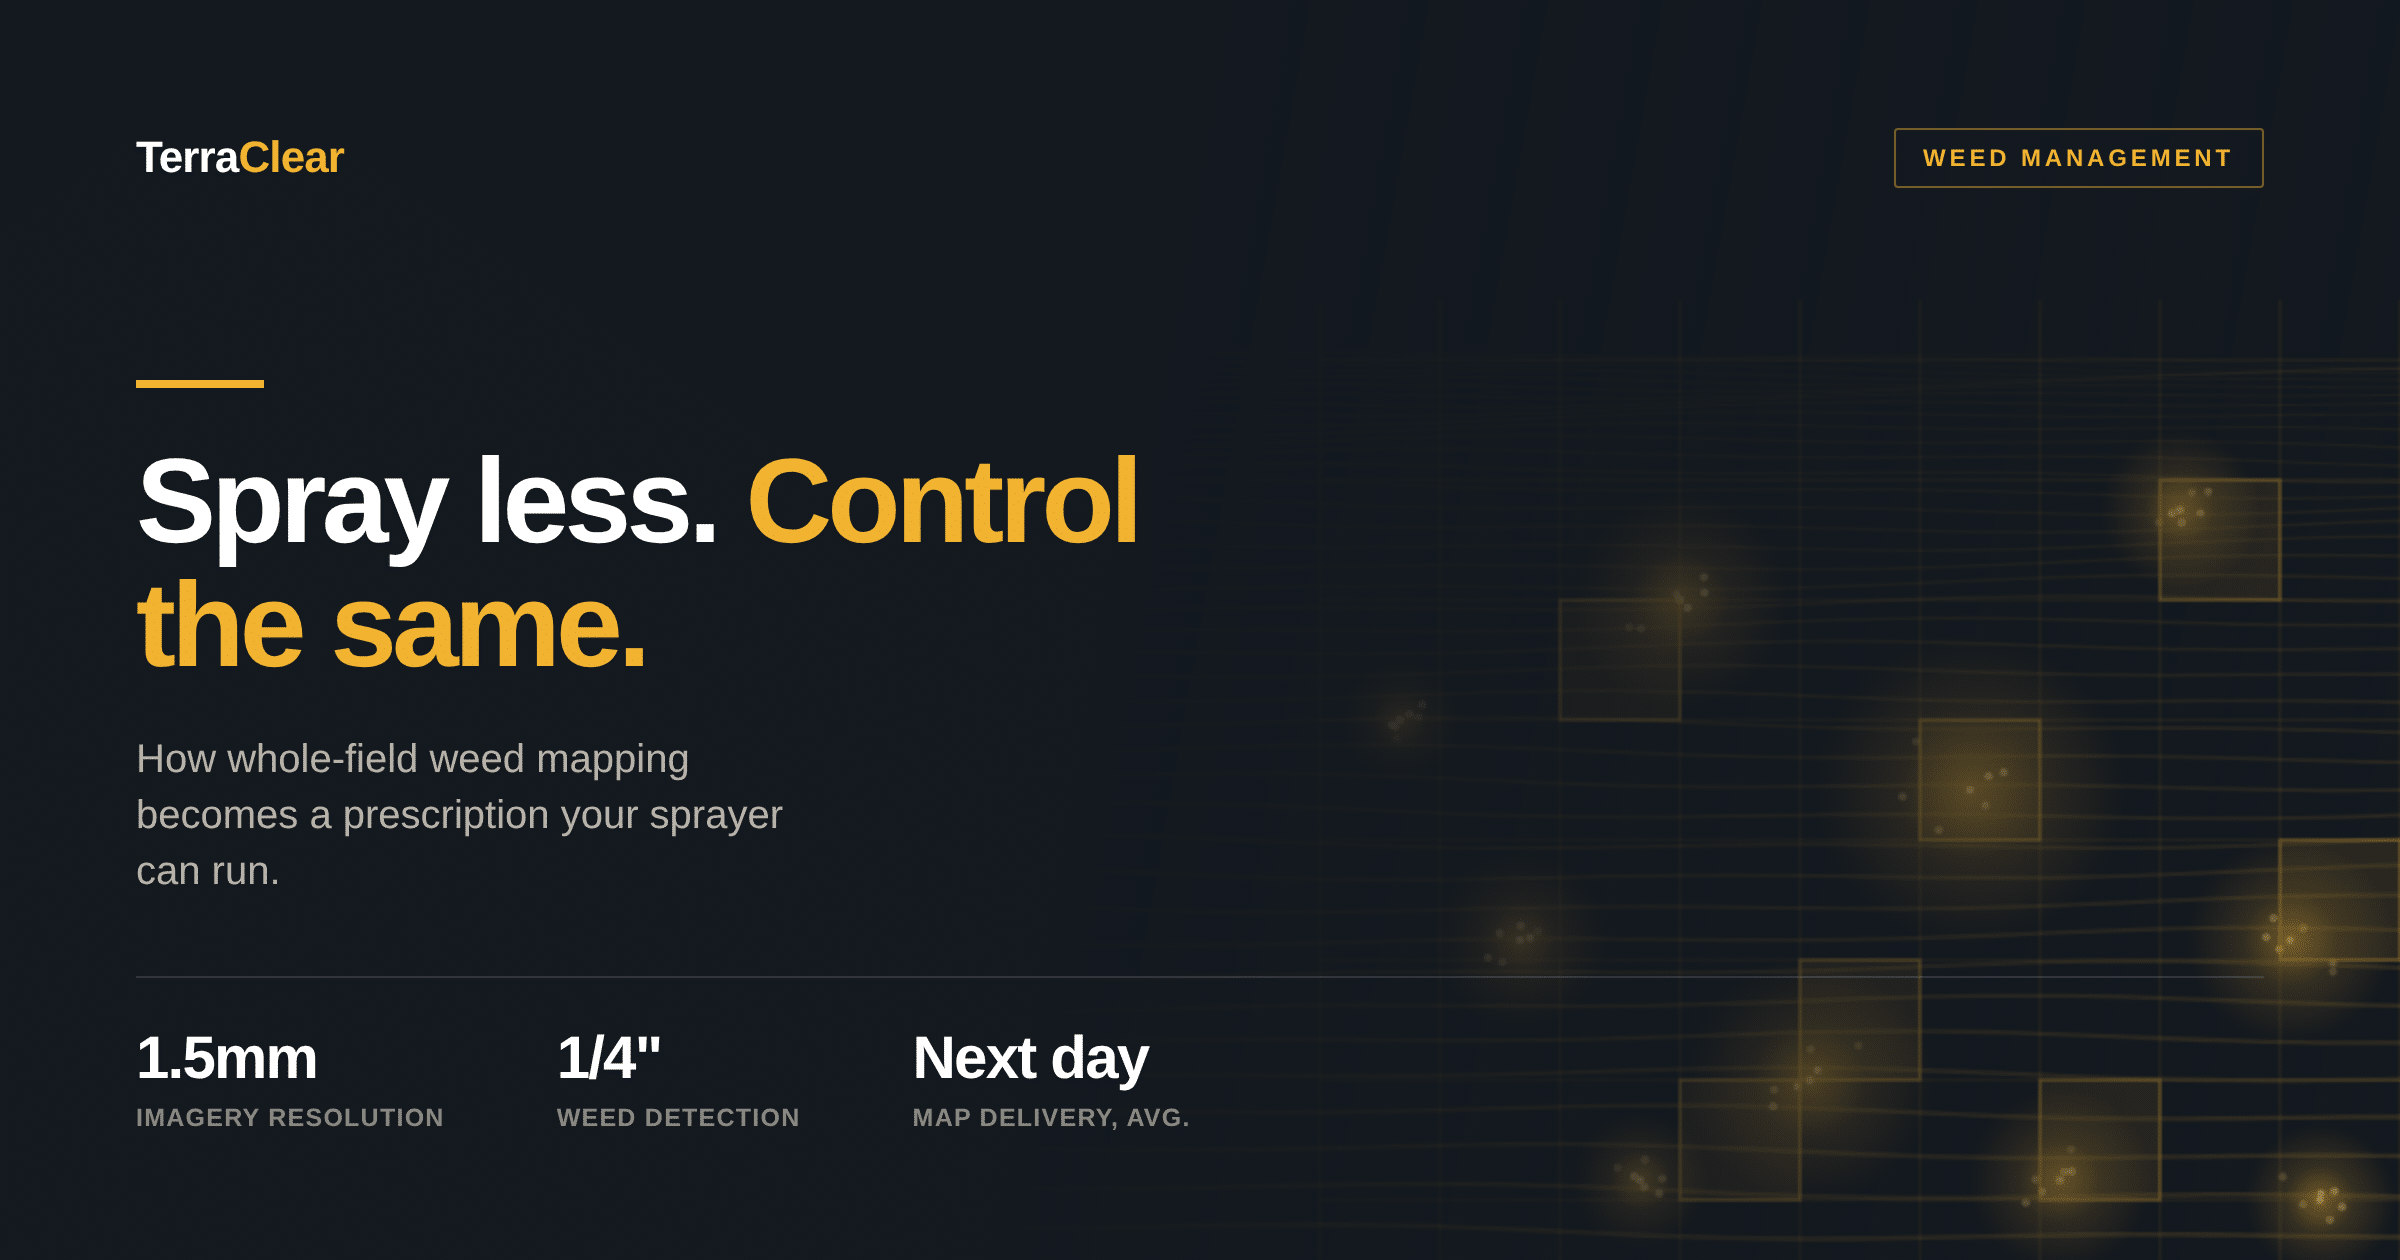
- Collect the imagery. A drone images the field at 1.5mm resolution GSD. TerraClear regularly covers more than 1,000 acres per day in favorable weather.
- Process it. Detection models trained on North American fields find and classify plants, measure density, and count stand.
- Get the map. Weed density and stand counts come back the next day on average, as a sprayer-ready prescription.
- Upload and spray. The prescription loads into your section or nozzle-control sprayer and runs at 10cm accuracy at full field speed.
Note what is missing from that list: buying anything. Step four runs on the sprayer sitting in your shed, provided it has section or individual nozzle control. TerraClear Weed Maps work with John Deere, Ag Leader, and Case IH systems.
Whole field, not a sample
Most field intelligence products sample. They image part of the field, or fly a grid, then interpolate between points to estimate what is in between. TerraClear images every acre, wall to wall, and interpolates nothing.
That distinction sounds academic until you think about where escapes actually live. They concentrate on headlands, along waterways, in field edges, and in the corner by the ditch you always turn short of. Those are exactly the places a sampled grid is most likely to miss, and exactly the places a resistant patch gets a foothold and goes to seed.
A sample tells you a field probably has a problem. Whole-field imagery at a quarter inch tells you where it is, while the weeds are still small enough to kill cheaply.
— Devin Lammers, CEO, TerraClear
The four-inch problem, and why turnaround is the spec that matters
Post-emergence herbicide works best on small weeds. Most labels are written around a weed-height ceiling, commonly around 4″, and efficacy falls off past it. So the value of a weed map is bounded by two numbers: how small a plant it can resolve, and how fast it reaches you.
TerraClear images at 1.5mm GSD, which resolves weeds 1/4″ and larger. That threshold is agronomic, not a spec-sheet flex. A map that first sees a weed at 6″ has already missed the window where control was cheap and easy.
Turnaround is the other half, and it gets underrated. K-State’s agronomy team makes the point plainly: the lag between collecting imagery and making the application can reduce efficacy as weeds mature past the target stage. A prescription that shows up a week late describes a field you no longer have. TerraClear returns maps the next day on average, which keeps the decision and the application inside the same window.
What the research actually shows about savings
Independent university work on targeted application is now substantial enough to give real numbers rather than vendor claims. The short version: savings are real, they are large, and they scale inversely with weed pressure. The cleaner the field, the more you save.
| Figure | What it is | Source |
|---|---|---|
| 44–91% | Range of herbicide savings measured across five soybean fields using drone-based weed mapping and targeted application. | Iowa State Extension, 2024 |
| $13.42 | Per-acre chemical cost savings in an Iowa State soybean demonstration, at roughly 50% product reduction versus broadcast. | Iowa State Extension, 2024 |
| $945 | Net savings modeled on a 100-acre field at 50% weed coverage, after subtracting $200 in mapping cost. | K-State Agronomy, 2026 |
One detail in the Iowa State work answers the question every farmer asks second. That trial recorded more than 99% herbicide injury on treated weeds and 94% weed mortality, with yields comparable to a broadcast application. Spraying less did not mean controlling less. You still put out your mix at your rate. You just stop putting it on bare ground.
K-State modeled something more useful than a single number, too. On a field with 45% broadleaf pressure and 25% grass pressure, running separate programs to each zone produced $2,390 in savings across 100 acres. That is the case for density zones rather than a simple on-off map.
TerraClear customers running precision spray plans have used up to 80% less chemical. Same control, less product.
Weed map or camera sprayer: which fits your operation
Both approaches spray less. They differ on two things that matter more than the technology: what you have to buy, and when the decision gets made. A camera system decides in real time on the boom. A prescription map decides in advance, on a file.
| Prescription map | Camera on the boom | |
|---|---|---|
| Equipment required | Section or nozzle control you likely already own | A new or retrofitted sprayer with sensing hardware |
| Capital outlay | None beyond the map itself | Significant, and tied to one machine |
| When the decision happens | Before you enter the field, with time to review it | In real time, at speed |
| Field conditions | Runs at full speed; dust and light do not affect the plan | Sensing quality depends on dust, light, and canopy |
| Freshness | As fresh as the flight, which is why turnaround matters | Live at the moment of application |
| Record kept | A durable file for resistance programs and year-over-year comparison | Application data, but no independent field record |
| Who can use it | You, your applicator, or your retailer, on any compatible rig | Whoever is running that specific machine |
Neither column is the wrong answer. If you are already replacing a sprayer, a camera system is worth a serious look. If you are not, a map gets you most of the same outcome without the machine.
When weed mapping pencils out, and when it does not
Being honest about this is the fastest way to a decision.
It usually pencils when:
- You farm roughly 1,000 acres or more, so per-acre savings add up to real money.
- Your sprayer has section or individual nozzle control.
- Pressure is patchy rather than solid. Patchy fields are where the savings live.
- You are managing resistance and want a record of what survived, not just what you sprayed.
It usually does not pencil when:
- Pressure is heavy and uniform fence row to fence row. If you are treating 90% of the acre anyway, broadcast is simpler.
- Your sprayer has no section control. There is nothing for the precision plan to actuate.
- Your chemistry is cheap enough that the mapping cost eats the savings.
The break-even is arithmetic, not faith. Field size, weed pressure, and product cost decide it. To see the numbers on your own acres, the Weed Savings Simulator compares broadcast against a precision plan.
What comes with a TerraClear Weed Map
TerraClear Weed Maps cover corn and soybeans today, with spring wheat and canola in development. Every map is built from whole-field imagery at 1.5mm GSD, resolves weeds 1/4″ and larger, and comes back the next day on average as a prescription your sprayer can run.
- Weed density zones you can assign different rates to, rather than a single on-off decision.
- Stand counts in the same flight, through V2 soybeans and V3 to V4 corn.
- Sprayer-ready output at 10cm accuracy for John Deere, Ag Leader, and Case IH.
- A durable field record for resistance management and year-over-year comparison.
TerraClear images at 1.5mm resolution, which resolves weeds 1/4″ and larger. That matters because post-emergence control is most effective and most economical on small weeds, well before they reach the height where labels and efficacy start working against you.
No. If your sprayer has section control or individual nozzle control, it can run a prescription map. That is the main practical difference between mapping and camera-based systems: mapping adds a file, not a machine.
Next day on average, from image collection to a sprayer-ready map. Turnaround is a functional spec rather than a convenience. Weed pressure changes fast in season, and a prescription that arrives late describes a field that has already moved on.
Yes, within the growth stages the models are built for. Weed mapping covers corn and soybeans, and stand counts are accurate through V2 soybeans and V3 to V4 corn. Talk to us about your timing and stage before you book acres.
Spray plans are built to 10cm accuracy, tied to RTK positioning, which is what makes nozzle-level actuation practical rather than theoretical. Mapping reaches centimeter-level precision on GPS-pinpointed locations, and the prescription guides the pass from there.
It depends on how patchy your pressure is. Iowa State measured savings between 44% and 91% across five soybean fields, and around 50% product reduction in its own demonstration. TerraClear customers have used up to 80% less chemical. Cleaner fields save more, because there is more bare ground to skip.
Corn and soybeans are commercially available now. Spring wheat and canola models are in development. Stand count maps for corn and soybeans come from the same flight.
See what a precision plan does to your spray bill
Run your own field size, crop, and weed pressure through the Weed Savings Simulator, or talk to us about reserving acres for the 2027 season.

Don Scribner is Director of Product at TerraClear, where he leads development of TerraClear Rock Maps, Weed Maps and development of TerraScout. He has spent 19 years in agricultural manufacturing and technology, building products around what farmers actually need in the field. He is based in Grangeville, Idaho.
Sources cited
- Houser, D. “Drone-based Weed Mapping for Targeted Spraying.” Iowa State University Extension Integrated Crop Management, December 2024. https://crops.extension.iastate.edu/post/drone-based-weed-mapping-targeted-spraying
- Kouame, J., Holman, J., Jha, G., et al. “Drone Imagery and Artificial Intelligence for Weed Mapping and Postemergence Herbicide Applications.” Kansas State University Department of Agronomy eUpdates, Issue 1109, June 2026. https://www.agronomy.k-state.edu/eupdates/2026/issue-1109-june-25/drones-ai-weed-mapping-2026.html
- TerraClear internal results, 2026 season. Figures reflect measured customer outcomes, not guaranteed results.

Charles Stover is a Marketing Manager at TerraClear. His marketing career spans 20+ years in broadcast, healthcare, SaaS, and ag tech, with a focus on building and executing award-winning, data-driven campaigns. He’s a University of Oregon School of Journalism grad, a girl dad, and a lifelong Ducks fan. Find him at Charles-Stover.com or on LinkedIn